‘A Sleeping Giant’ – part deux
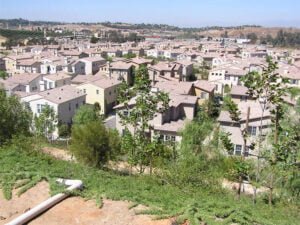
As mentioned in a recent post, a report released earlier this month by the Los Angeles County Economic Development Corp. indicated Inland Southern California (Riv-SB-Ont) will continue to lead the state in population, housing and employment growth. It also reports the region’s personal income and taxable sales continue to climb as well.
Likewise, a similar report by local economist John Husing — citing 2004 Census Bureau figures — shows an additional 80,000 residents within the Inland region holding a bachelor’s degree or higher since the 2000 Census (a 31% growth rate).

So, outside of the obvious increase in crowds and traffic, what does this really mean for Inland Southern California? More importantly, what kind of opportunity do these changes actually offer?
First, the data reaffirms the Riverside-San Bernardino-Ontario Metropolitan Statistical Area (MSA) now outranks both the Orange and San Diego county statistical areas in two key areas: population and taxable retail sales. Second, the rapid growth in both education and personal income indicates a significant push toward a white-collar economy. Third, extrapolation of the data shows Inland SoCal outranks numerous other metropolitan regions across the country, signaling the need for fundamental changes on many influential fronts.

Without a doubt, the growth provides a great opportunity for Inland SoCal to raise its overall profile, first within California and second within the nation. But doing so will require the region to aggressively push, both at the state and national levels, for greater independence from Los Angeles political and media interests — a daunting challenge to say the least. But it can be done. Regardless, the opportunity should not be overlooked — nor missed.
Given the continued population boom and overall economic growth, the real question is — how long will this “sleeping giant” continue to slumber?
Related
- Los Angeles County Economic Development Corp.
- Economics & Politics, Inc. – January 2006 Quarterly Economic Report (John Husing)
Previous
- RaincrossSquare.com – ‘A Sleeping Giant’ (Feb. 9)
Population | Taxable Retail Sales | Total Personal Income |
2000 | 2004 | Gain | 2000 | 2004 | Gain | 2000 | 2004 | Gain | |
Los Angeles-Long Beach | 9.52 | 10.22 | 7.35% | $70.32 | $94.63 | 34.57% | $279.05 | $349.87 | 25.38% |
Riverside-San Bernardino-Ontario | 3.25 | 3.82 | 17.54% | $24.99 | $42.70 | 70.87% | $74.87 | $104.38 | 39.41% |
Orange County | 2.84 | 3.05 | 7.39% | $27.48 | $39.02 | 41.99% | $106.00 | $131.26 | 28.83% |
San Diego County | 2.81 | 3.05 | 8.54% | $24.95 | $35.32 | 41.56% | $92.65 | $118.70 | 28.11% |
Ventura County | .753 | .813 | 7.97% | $6.50 | $9.08 | 39.69% | $25.36 | $31.18 | 22.95% |
Source: LAEDC – Feb. 2006 | Components: Defined by US Census Bureau
When compared statewide, the Riverside-San Bernardino-Ontario MSA ranks as the second most-populous MSA in California:
Rank | Metropolitan Statistical Area* | Population (millions)** |
1 | Los Angeles-Long Beach | 10.22 |
2 | Riverside-San Bernardino-Ontario | 3.82 |
3 | Orange County | 3.056 |
4 | San Diego County | 3.051 |
5 | Alameda-Contra Costa (Oakland) | 2.53 |
6 | Sacramento-Placer-El Dorado | 1.85 |
7 | San Francisco-San Mateo-Marin | 1.77 |
8 | Santa Clara (San Jose) | 1.76 |
9 | Fresno-Madera | 1.02 |
10 | Ventura County | .813 |
*Components: Defined by US Census Bureau | **Source: CA Dep’t of Finance, Jan. 2005
When compared nationally, Riverside-San Bernardino-Ontario ranks as the 13th most-populous region — sandwiched between San Francisco and Phoenix, but larger than the Seattle, Minneapolis, and St. Louis regions:
Rank | Metropolitan Statistical Area* | Population** |
1 | New York-Northern New Jersey-Long Island, NY-NJ-PA | 18,709,802 |
2 | Los Angeles-Long Beach-Santa Ana, CA | 12,925,330 |
3 | Chicago-Naperville-Joliet, IL-IN-WI | 9,391,515 |
4 | Philadelphia-Camden-Wilmington, PA-NJ-DE-MD | 5,800,614 |
5 | Dallas-Fort Worth-Arlington, TX | 5,700,256 |
6 | Miami-Fort Lauderdale-Miami Beach, FL | 5,361,723 |
7 | Houston-Sugar Land-Baytown, TX | 5,180,443 |
8 | Washington-Arlington-Alexandria, DC-VA-MD-WV | 5,139,549 |
9 | Atlanta-Sandy Springs-Marietta, GA | 4,708,297 |
10 | Detroit-Warren-Livonia, MI | 4,493,165 |
11 | Boston-Cambridge-Quincy, MA-NH | 4,424,649 |
12 | San Francisco-Oakland-Fremont, CA | 4,153,870 |
13 | Riverside-San Bernardino-Ontario CA | 3,793,081 |
14 | Phoenix-Mesa-Scottsdale, AZ | 3,715,360 |
15 | Seattle-Tacoma-Bellevue, WA | 3,166,828 |
16 | Minneapolis-St. Paul-Bloomington, MN-WI | 3,116,206 |
17 | San Diego-Carlsbad-San Marcos, CA | 2,931,714 |
18 | St. Louis, MO-IL | 2,764,054 |
19 | Baltimore-Towson, MD | 2,639,213 |
20 | Tampa-St. Petersburg-Clearwater, FL | 2,587,967 |
*Source: Census: MSA Estimates, July 2004 (file: CBSA-EST2004-04) | **Source: Census: MSA Estimates, July 2004 (file: CBSA-EST2004-01)
Based upon the above rankings, it’s interesting to note Inland Southern California easily outranks a number of metro areas with one or more major professional sports teams, including many not listed above: Pittsburgh (21), Denver (22), Cleveland (23), Portland, OR (24), Cincinnati (25), Sacramento (26), Kansas City (27), Orlando (28), San Antonio (29), San Jose (30), Columbus, OH (31), Indianapolis (35), Milwaukee (36), Charlotte, NC (37), Nashville (39), New Orleans (40), Memphis (41), Jacksonville, FL (42), Buffalo (45), Salt Lake City (50), Raleigh, NC (51), and of course, Green Bay, WI (153).
NOTE: Recent changes in the organization of metropolitan areas and their components by the Census Bureau produces some inconsistencies between various statistical data sets: MSA, CSA, CBSA vs. CMSA, PMSA. As always, this site attempts to sort out these inconsistencies as best as possible.
Sources: Los Angeles Economic Development Corporation, Economics & Politics, Inc. (John Husing), U.S. Census Bureau, California Department of Finance
2024 PAGE UPDATE: Added additional photos; removed outdated links to LAEDC February 2006 report, Economics & Politics January 2006 QER, California Department of Finance January 2005 report, and U.S. Census MSA Estimates July 2004 documents.


6 Comments